2024 Higher Education Marketing Benchmarks: Get Past Your Blindspot
June 25th, 2024 by
Key Insights
- A shifting higher education playing field is causing universities to reevaluate their results and the costs associated with them.
- Despite increased competition and an evolving modern learner, higher education marketing departments can still reach their enrollment goals by tracking the right metrics to inform future strategies.
- New Search Influence and UPCEA research reveals a blind spot in higher education marketing tracking: cost per inquiry and cost per enrollment.
- Cost per inquiry and cost per enrollment are compasses that help you determine your marketing budget’s efficiency and effectiveness. By tracking these key metrics, you can see what’s working and what’s not as part of the bigger picture.
- Marketers who keep a pulse on their campaigns via in-depth tracking are more satisfied with their overall marketing performance.
Changing demographics, limited resources, and increased competition in higher education are making university leaders rethink their marketing strategies.
Colleges and universities need to pinpoint where to invest their resources for the best return — and where to trim the fat.
This starts with tracking the right higher education marketing metrics.
While overall marketing metrics offer valuable insights, the ability to analyze the data at the program level will ultimately determine which institutions meet enrollment goals and which fall behind.
In “What Gets Measured Gets Managed,” our 2024 higher education marketing benchmark research conducted in partnership with UPCEA, we analyzed whether professional, continuing, and online (PCO) units are tracking two key metrics that could inform critical outcomes: cost per inquiry (CPI) and cost per enrollment.
See the state of tracking in higher education marketing and how your institution compares to others in the industry.
Key Findings of the UPCEA Research Study
The average annual digital ad spend on PCO units is nearly $900k
The modern learner has gone digital, and the higher education marketing sector rightfully followed suit.
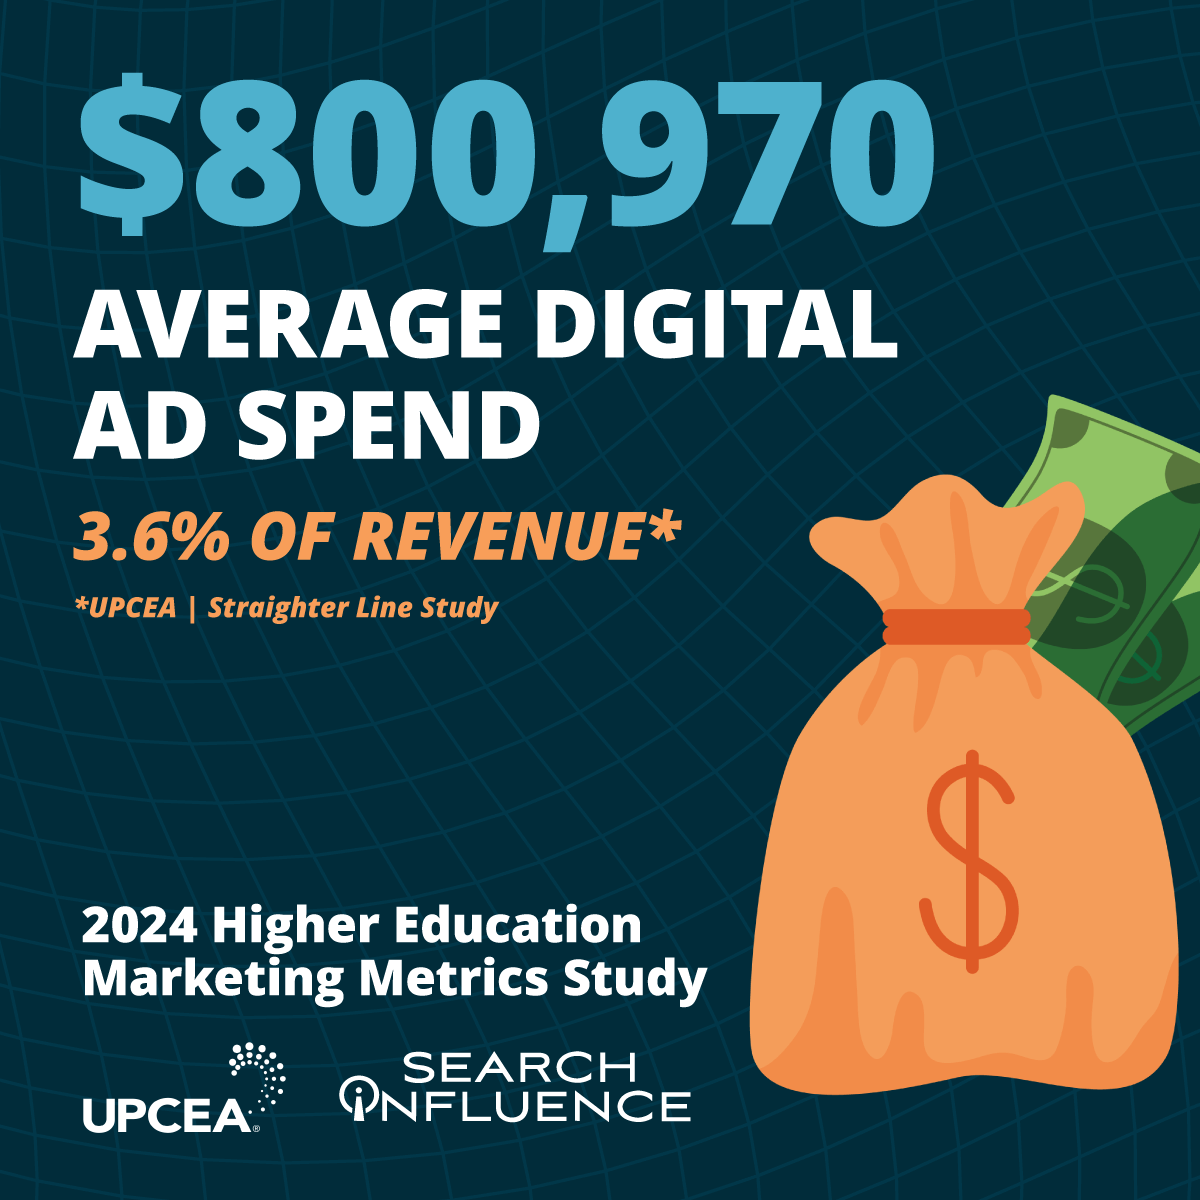
Professional and online education units spend an average of $800,970 each year on digital advertising spend, including paid search, social advertising campaigns, and connected TV (CTV) streaming ads.
As the new learner searches for higher education programs online, digital advertisers must meet inquirers where they are in their enrollment journey.
This involves continuous learning, adapting, testing, and re-testing — a process that starts with tracking the right campaign data, like cost per inquiry.
Less than half of higher ed marketers track cost per inquiry
Cost per inquiry is the most important metric to track to reduce the expenses of driving your prospects to take action. But if you aren’t tracking this key metric, the good news is you’re not alone.
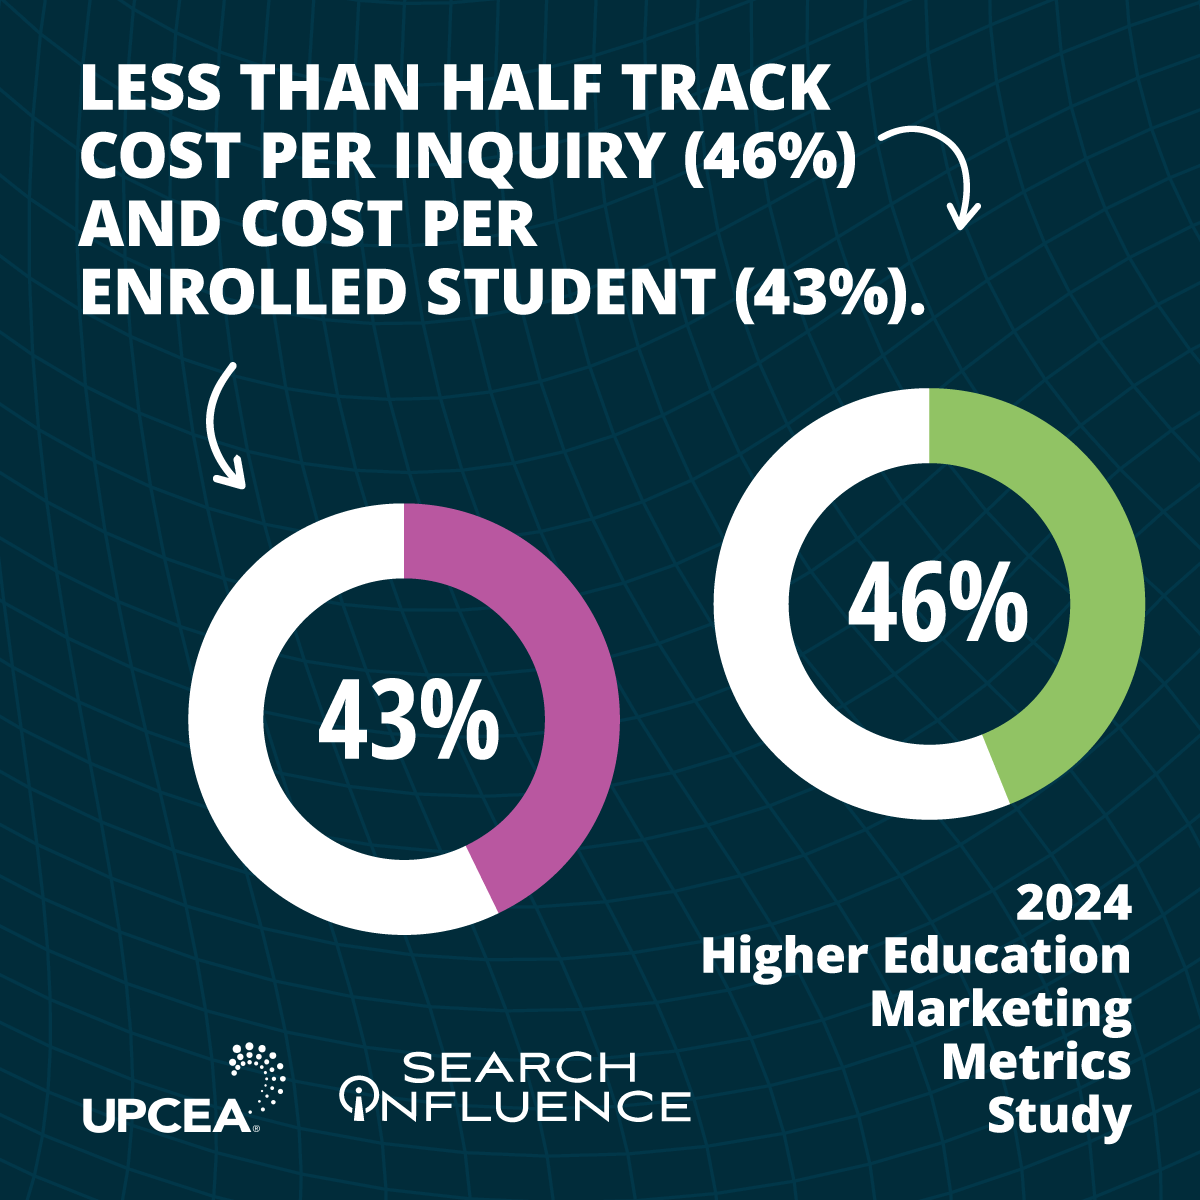
Today, most higher education marketers have a fairly strong grasp of the source of their inquiries — not necessarily the costs associated with them. Nearly three-quarters (73%) of marketing units track inquiry sources for their PCO programs, while less than half track cost per inquiry (46%) or cost per enrolled student (43%).
And, for nearly one out of five research survey respondents (17%), metric tracking isn’t even on their radar.
The average cost per inquiry (CPI benchmark) for professional and online education is $140.
Of the 46% of PCO units that track cost per inquiry, the average CPI for the 2022-2023 fiscal year was $140, with a median of $106. Roughly one-third (32%) of PCO units had a CPI between $50 and $100, 15% between $101 and $150, and 15% over $200.
The expenses associated with this CPI benchmark for marketing varied but most often consisted of:
- Media spend (88%)
- All marketing expenses, excluding salaries (46%) and agency management fees (39%)
Result satisfaction is fairly low, with 38% of survey respondents reporting they’re content with their school’s CPI, and 27% not sure.
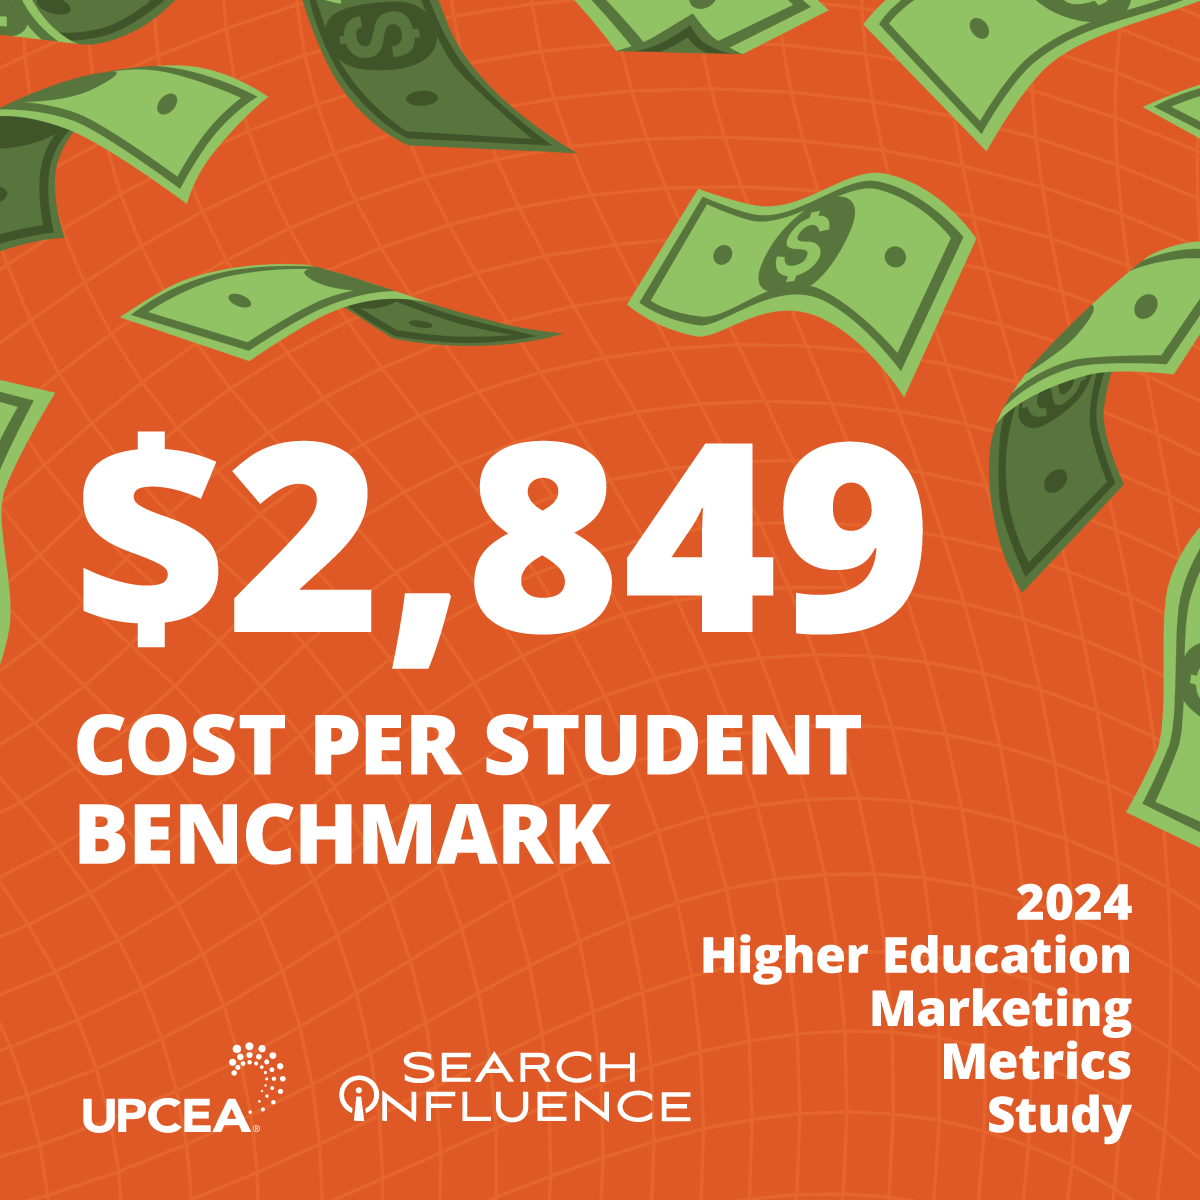
The average professional and online education cost per enrolled student is $2,849.
Of the 43% of PCO units that track cost per enrolled student (43%), the average cost per enrolled student for the 2022-2023 fiscal year was $2,849, with a median of $1,173. 27% of PCO units had a cost per enrolled student under $500, and an additional 27% had a cost per enrolled student of over $3,000.
Email marketing is most often managed in-house, while digital advertising is most often outsourced
Nearly three-quarters (73%) of higher ed email marketing and half of search engine optimization (44%) efforts are entirely managed in-house. However, digital advertising remains an item ripe for outsourcing, with half of the survey respondents exclusively outsourcing their Google paid search campaigns to experienced agencies.
Whether it’s due to budget constraints or simply just a preference to keep things internal, most PCO units mix and match what is outsourced and what is managed in-house. However, it’s important to note that managing any marketing campaigns in-house requires universities to have the time, skills, and resources to monitor campaigns and stay up to date on trends.
If you’re unsure whether partnering with an agency is the best option for your university, start a conversation with us today.
Marketers who track their campaigns are more happy with performance
Tracking campaign performance has a direct link to overall marketing satisfaction.
According to our research findings, those who are satisfied with their back-end campaign tracking capabilities are more likely to be satisfied with how those campaigns perform in the wild.
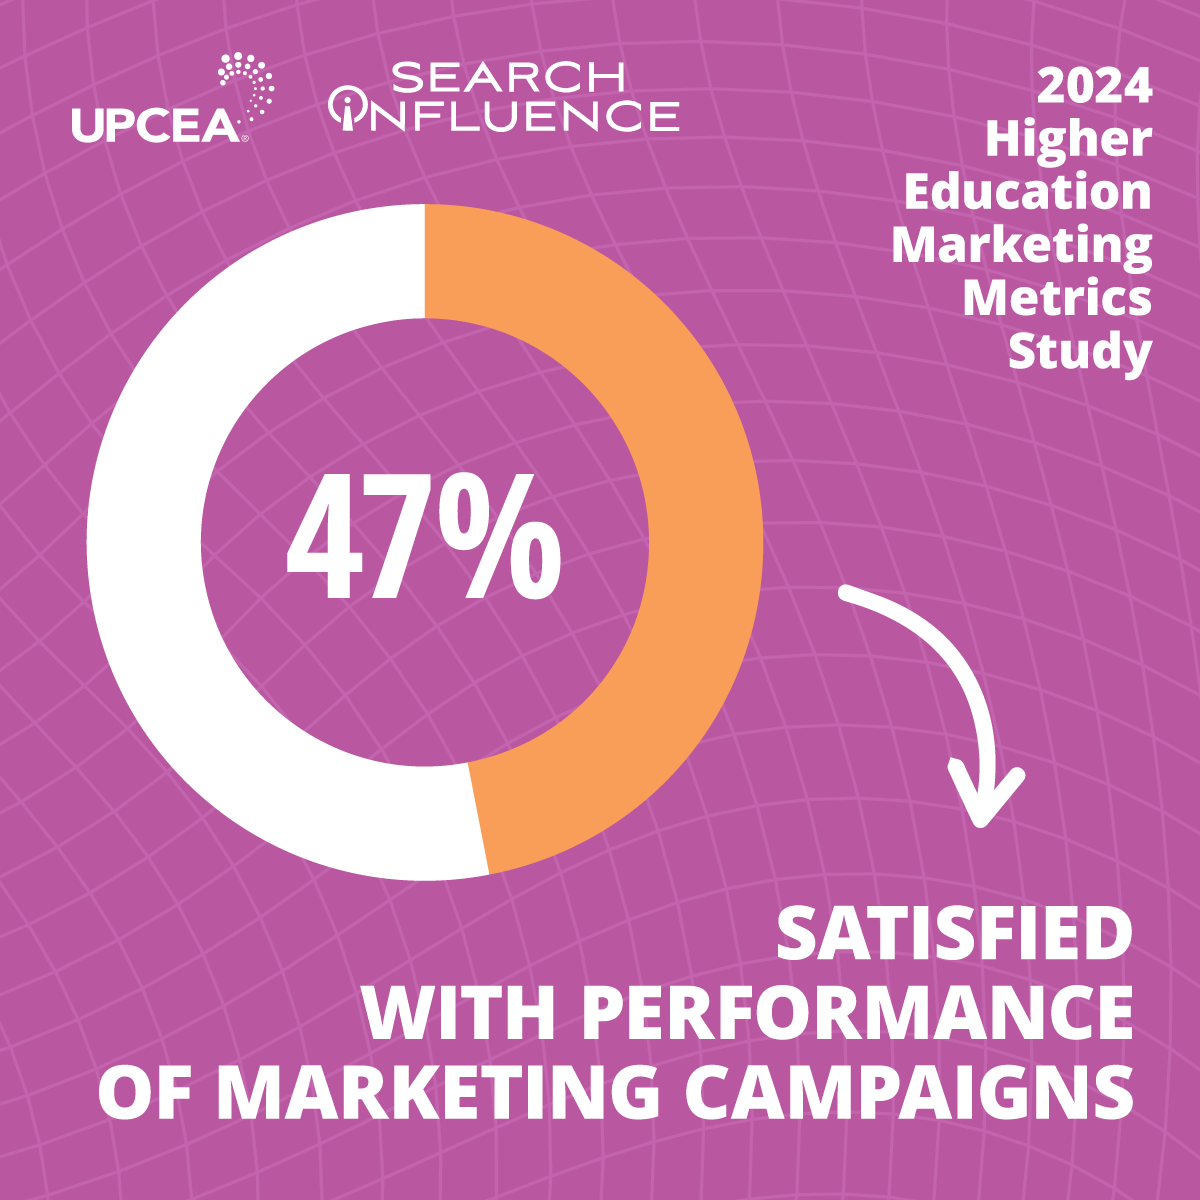
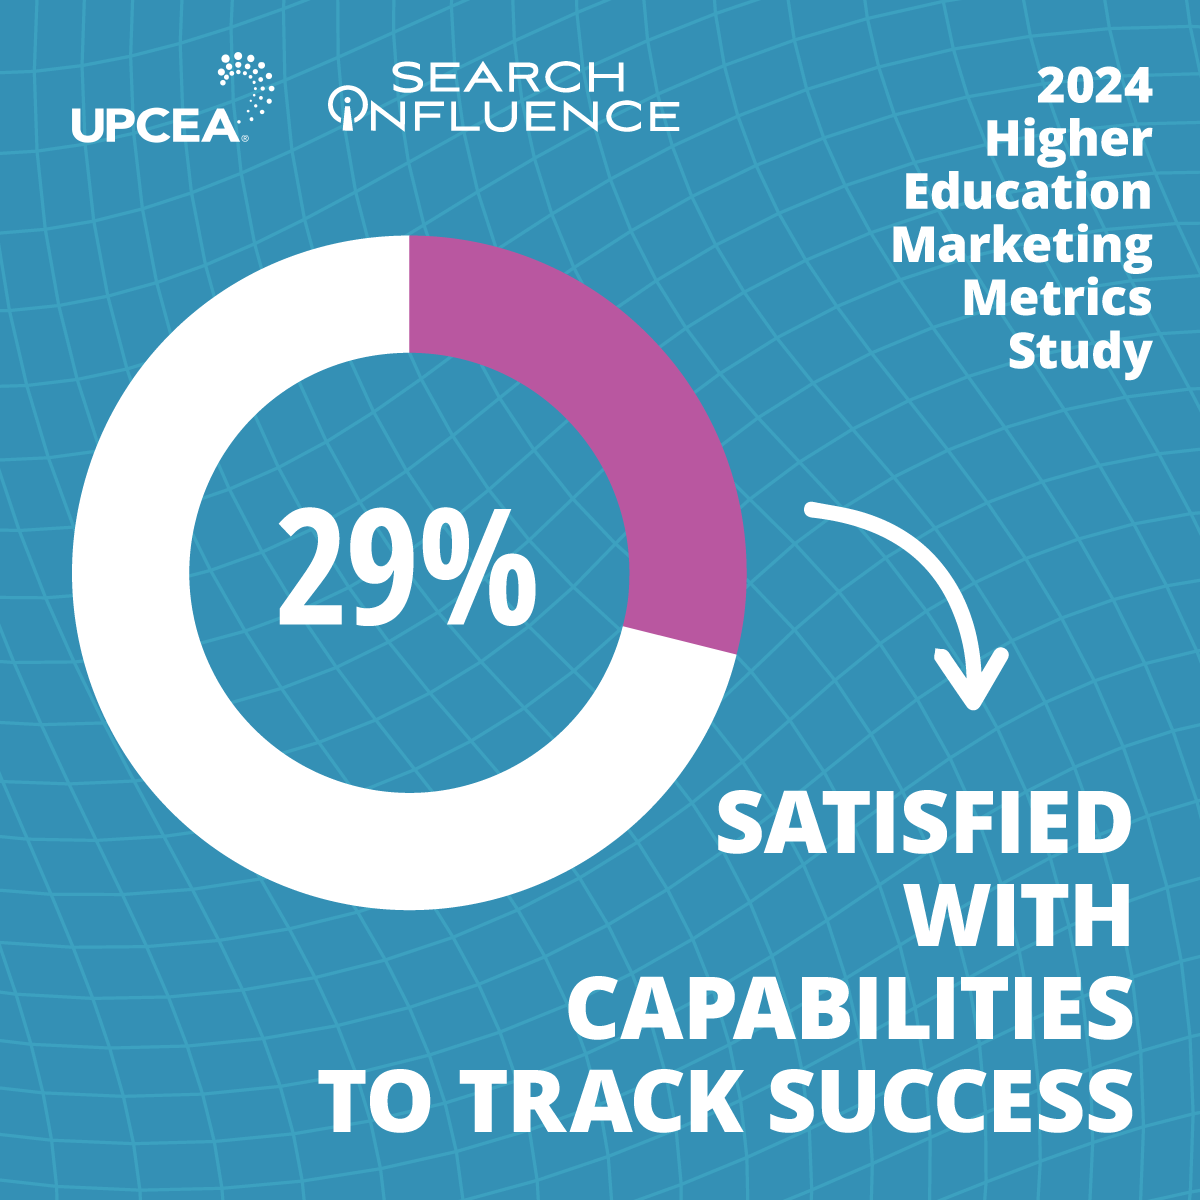
Despite this, many marketers lack the know-how, resources, and time to keep a steady pulse on their campaigns, leaving key metrics to fall to the wayside — entirely overlooked. Fewer than half (46%) of survey respondents report satisfaction with their campaign’s performance, and only 29% are satisfied with their ability to track such success.
This blind spot then creates a grueling cycle of campaign launch → result dissatisfaction → repeat, with no guide for improving results.
How Higher Education Marketing Benchmarks Drive Marketing Outcomes
There’s an old saying by British mathematician Lord Kelvin that goes, “To measure is to know.”
When thought of strategically, digital advertising is data for dollars. Within a single campaign, you can gain insights into its effectiveness, ranging from lead quality to cost per inquiry, without hours of tedious pen-to-paper calculations. And, with industry-wide higher education marketing benchmarks, you can compare how you’re doing with competitors and determine ways to refine your budget and outcomes.
Going beyond basic metrics like cost-per-click and leveraging more granular metrics like cost per inquiry helps you:
- Have more confidence in your inquiry quality and quantity
- Know which campaigns are performing or underperforming, and which optimizations to make to improve results
- Assess how adjustments like budget and targeting changes affect campaign results
- Establish a starting point to dive deeper into metrics like conversion rates as prospective students move through the enrollment funnel
Armed with a well-rounded understanding of each inquiry, you can drive home campaigns that resonate without wasted ad spend.
How to utilize cost per inquiry
Cost per inquiry isn’t a metric exclusive to higher education institutions. Healthcare, hospitality, and B2B marketers have long relied on this measurement to assess the state of their incoming inquiries.
Why? Because CPI is a direct measurement of budget efficiency and effectiveness.
Your institution’s CPI is calculated by dividing how much you’ve spent on marketing and advertising by the number of inquiries received. In higher education, inquiries commonly originate from emails and college websites, specifically:
- Request for information forms
- Brochure request forms
- Request a visit forms
Utilizing a CPI metric gives your marketing department valuable insights into your advertisements’ impact. It helps you examine your performance and provides guidance on budgeting and refining your marketing strategy.
But, just like any marketing metric, CPI works best when it’s evaluated as part of the bigger picture. Building your data stack with additional key metrics, like cost per enrolled student, helps you visualize the cost of the entire conversion process, from the initial inquiry to final enrollment.
How to utilize cost per enrolled student
Cost per inquiry is a leading indicator of success.
Cost per enrollment is the most definitive metric you can review to see how much you are spending to get a new student.
This metric encompasses the total costs invested in securing a student’s enrollment, factoring in expenses from the initial marketing efforts and campaign launch all the way to the student’s matriculation. Most often, these include:
- Media spend
- Agency management fees
- University marketing team salaries
- All other marketing undertakings
When analyzing cost per enrollment over time, or comparatively within your programs, you can get a sense of where you need to make the biggest changes – either budget, resource allocation, or overall strategy.
Leveraging cost per inquiry and cost per enrollment in tandem can lead you down the right path to campaign effectiveness. Ideally, by adopting these metrics into your tracking tool kit, your higher education institution can prioritize the digital marketing campaigns that yield the most inquiries at the lowest costs.
Not sure how to calculate your school’s cost per inquiry or cost per enrollment? See our new CPI Calculator or download our free worksheet for help getting started.
Gain Insights Into Your Higher Ed Marketing Performance With Search Influence
The bottom line: Tracking cost per inquiry and cost per enrollment is an untapped opportunity for many schools looking to maximize every marketing dollar invested. These often neglected, yet incredibly insightful, metrics help you understand what’s working, what isn’t, and how to allocate your budget accordingly for the best results.
We hope that, with this new industry-wide benchmark, your college or university will better judge the performance of your professional and online program marketing.
If you’re unsatisfied with your digital advertising performance, tracking these key performance metrics can get you past your blind spot. After all, you can’t improve what you don’t measure, and what gets measured gets managed.
Download the full 2024 higher education marketing benchmark research study with UPCEA today.

