How Infographics Can Give Your Online Strategy a Facelift
May 13th, 2015 by


No industry knows the importance of image more than plastic surgery. Before and after pictures are worth a thousand words, and prospective patients heavily rely on visual information derived from those pictures when deciding which cosmetic procedures to explore. However, plastic surgery websites do not have to restrict themselves to just pre- and post-op imagery.
Introducing Infographics
Simply put, infographics are images that visualize information or data in a compelling, creative, and colorful way.
Businesses are increasingly turning to infographics to present their industry contributions. For example, Web company Unbounce, estimates that the use of infographics has seen a huge surge in recent years—an 800 percent increase from 2010 to 2012. Research conducted by AnsonAlex, a tech company specializing in producing tutorials, found that publishers with ample infographics grow website traffic 12 percent faster than those with no infographics.
Infographics are clearly more than a passing trend; they are a strategic marketing opportunities upon which the plastic surgery industry can capitalize.
Infographics Make Eye-Catching Websites
If you are looking for a new way to promote your plastic surgery clinic’s webpage, infographics are a surefire strategy for keeping eyeballs glued to your site. A single infographic has the potential to reach as many as 15 million Internet users through web searches, according to an infographic by Top Marketing Schools. In fact, searching ‘plastic surgery infographic’ yields 283,000 results on Google. Create and post infographics on your site to take advantage of this pool of interested users.
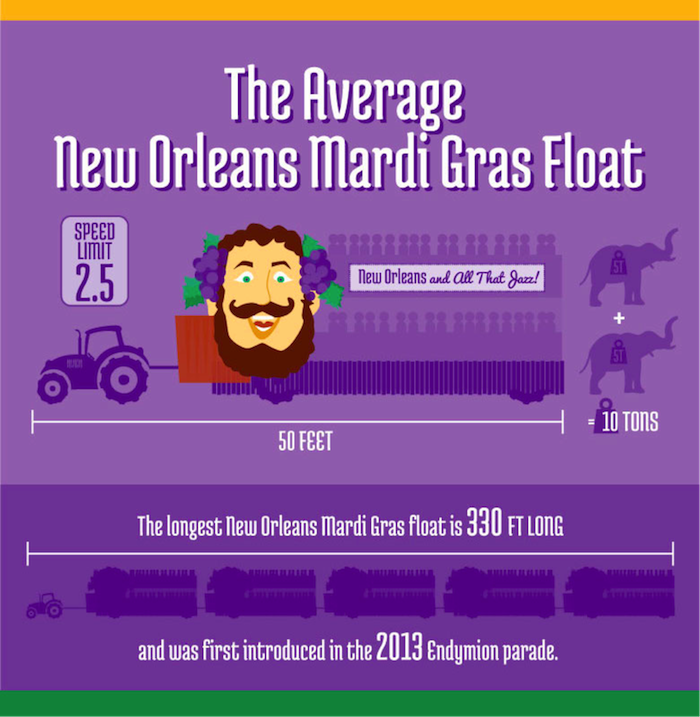
The average page visit lasts under a minute, but an infographic can keep a user reading for longer. In fact, a Search Influence-produced infographic detailing the legendary New Orleans Mardi Gras renewed interest among people that visited the official New Orleans tourism guide website. While visitors to the website typically spend an average of two minutes browsing, visitors to the Mardi Gras infographic page were spending upwards of eight minutes.
Ninety percent of the information processed by our brains is visual, so it’s only logical that we are more drawn to vibrant images than walls of text. Readers are likely to skim the infographic, absorb the information, and then explore the site further to learn what else you have to offer.
Be sure to add some written content outside the graphic. Site crawlers cannot scan images, so your optimized content must also appear elsewhere on the page in order to attract search engine hits.
To keep your users on your website, it is vital that your infographic loads quickly! The average user expects a page to load in under three seconds and will not hesitate to close a window that does not deliver fast enough. The quicker your site loads, the better your conversion rates will be.
Infographics Boost Social Media Reach
Your plastic surgery clinic can also use infographics to attract more social media followers and shares. That’s because images perform well on Twitter—even better than videos! For example, images get 128 percent more retweets than video tweets, according to Quicksprout. Similar to web pages, our eyes are instinctively drawn to tweets with alluring images.
To properly post your infographic on social media, however, you have to make sure it is shareable and easily traced back to your site. Use an embed code in the infographic so other industry professionals can easily add it to their sites. On the graphic, place your website address and the name of your clinic in bold letters. If your link or commentary is deleted through sharing, your clinic name will still remain. Using easy share links such as ow.ly or bit.ly can also make it easier to share on Twitter, Facebook, and Pinterest.


