Turn Data Into Decisions With Your 2025 KPI Dashboard
February 11th, 2025 by
Key Insights
- KPI dashboards consolidate key performance metrics into a single, visually intuitive platform, providing clarity and actionable insights.
- Aligning KPIs across marketing, sales, and leadership ensures all teams work toward shared strategic goals. A centralized dashboard eliminates data silos, fosters collaboration, and enhances decision-making.
- KPI dashboards empower marketers to make budget-conscious, data-backed decisions, whether tracking costs like CPI and ROI or monitoring performance across multiple data sources,
A KPI dashboard is a tool that visualizes your key performance indicators (KPIs) and consolidates these critical metrics in an easily digestible format, typically through charts and graphs. Modern KPI dashboards allow you to quickly analyze your performance and uncover actionable insights to optimize your campaign while bypassing the headaches of data overload.
Imagine a NASCAR driver pushing the pedal to the metal without a dashboard above his wheel to help guide his decision-making. That’s pretty risky.
Not using a KPI dashboard to drive marketing decisions in your online ad campaigns is similarly dangerous.
In this blog, we’ll explain how to use your KPI dashboard software to maintain data accuracy, track progress, and boost marketing performance in 2025 and beyond.
Buckle up — you’re on the fast track to valuable insights.
The Top 5 Things You Should Use Your KPI Dashboard For
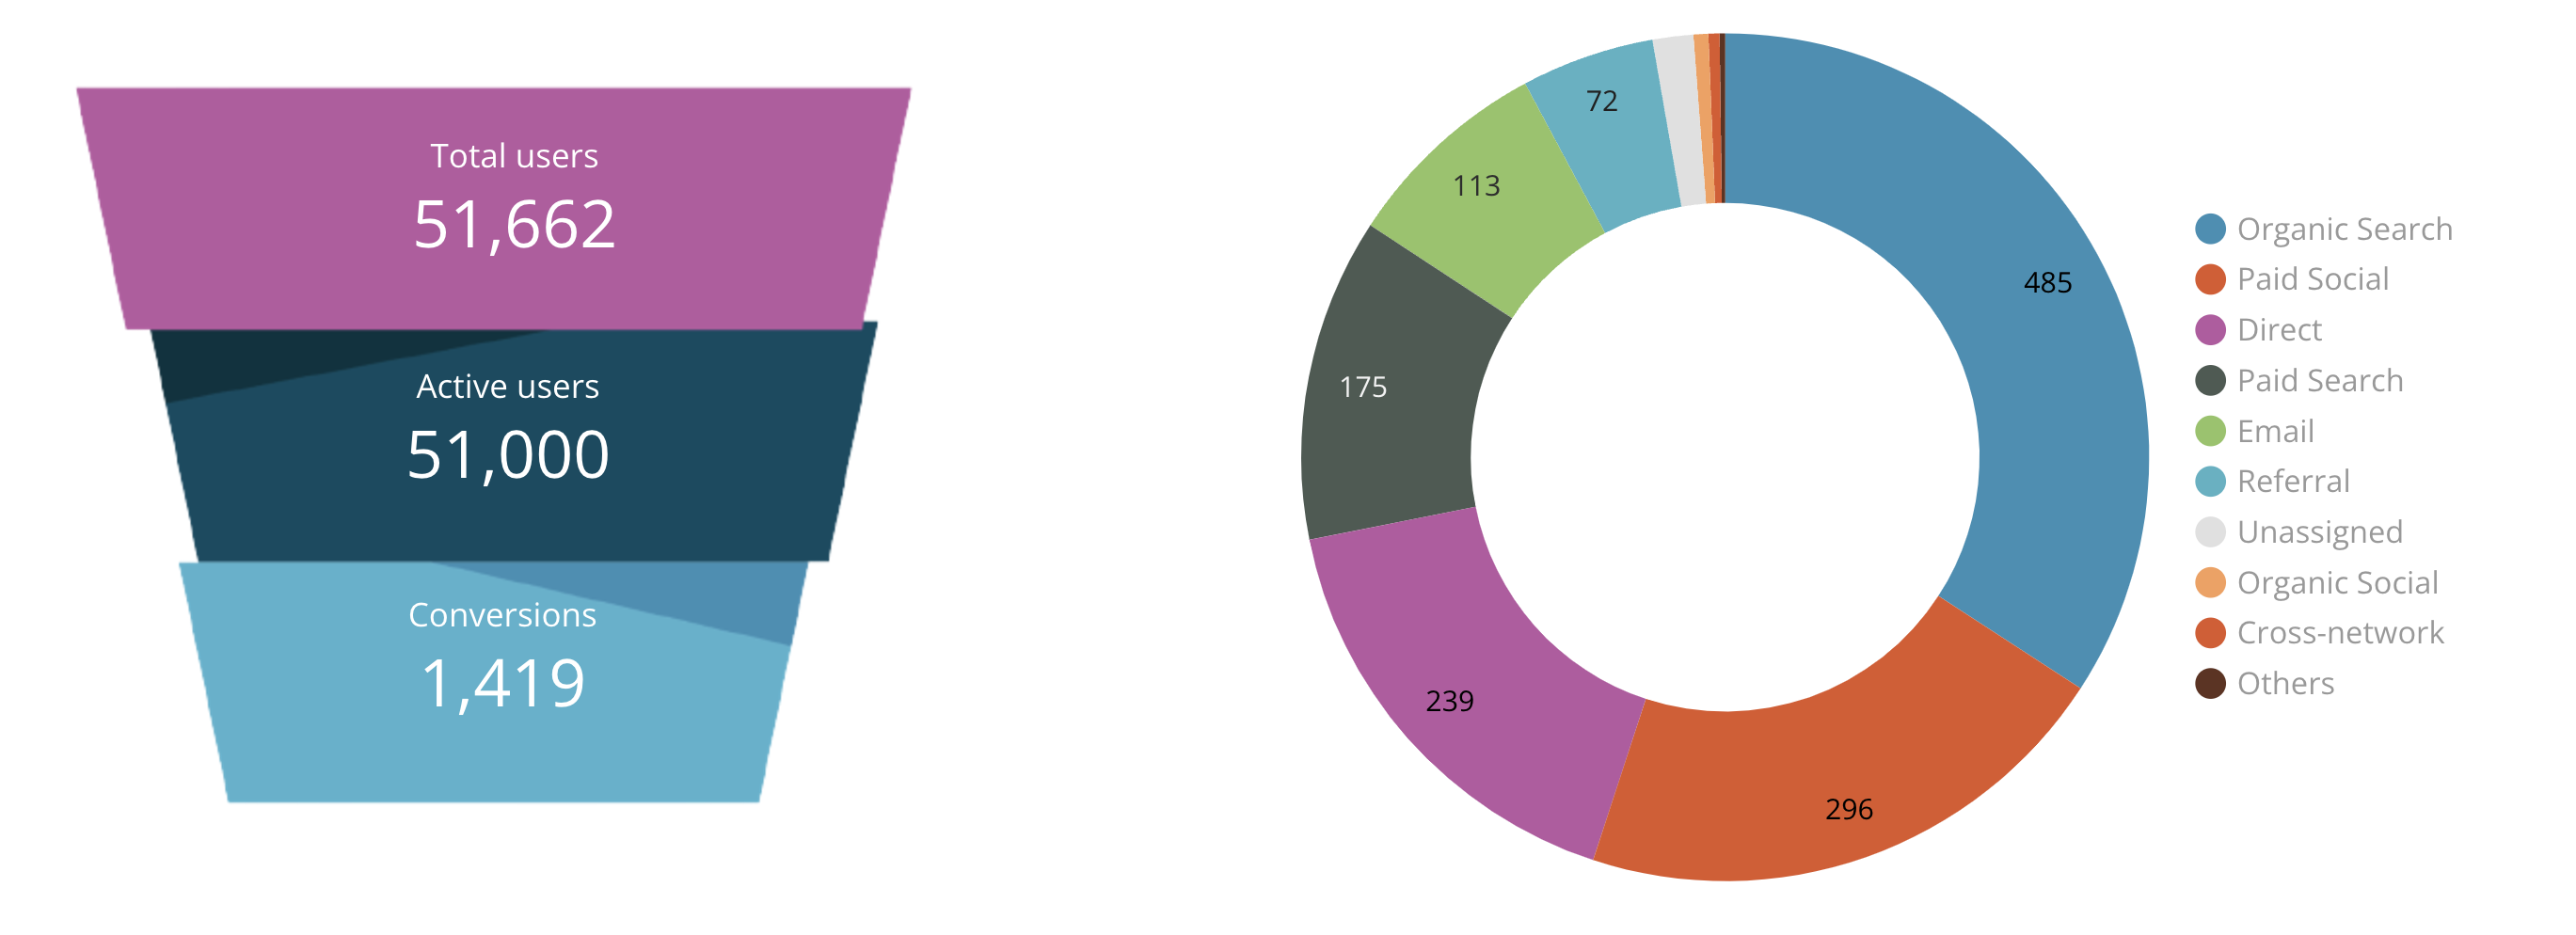
1. Visualize your funnel and identify fallout points
A well-designed KPI dashboard brings clarity to complex data, enabling marketers to pinpoint fallout points at each stage of the funnel. By analyzing historical data and tracking key metrics such as lead-to-MQL and MQL-to-SQL conversion rates, you will quickly find areas where your funnel doesn’t perform as expected.
Benefit: Pinpoint friction points to improve conversions
When you visualize key performance indicators, you’re not just looking at raw numbers — you’re gaining actionable insights. By identifying where prospects are dropping out, you can adjust messaging, optimize touchpoints, and create a smoother journey for your audience.
Case study: Higher education KPI dashboard example
Search Influence collaborated with one of our long-time higher education clients to create a KPI dashboard that simplified their data and visualized their campaign outcomes.
This private research university’s marketing objective was to continuously grow incoming inquiries and start applications for their priority degrees and programs through digital advertising, SEO, email marketing, and PR.
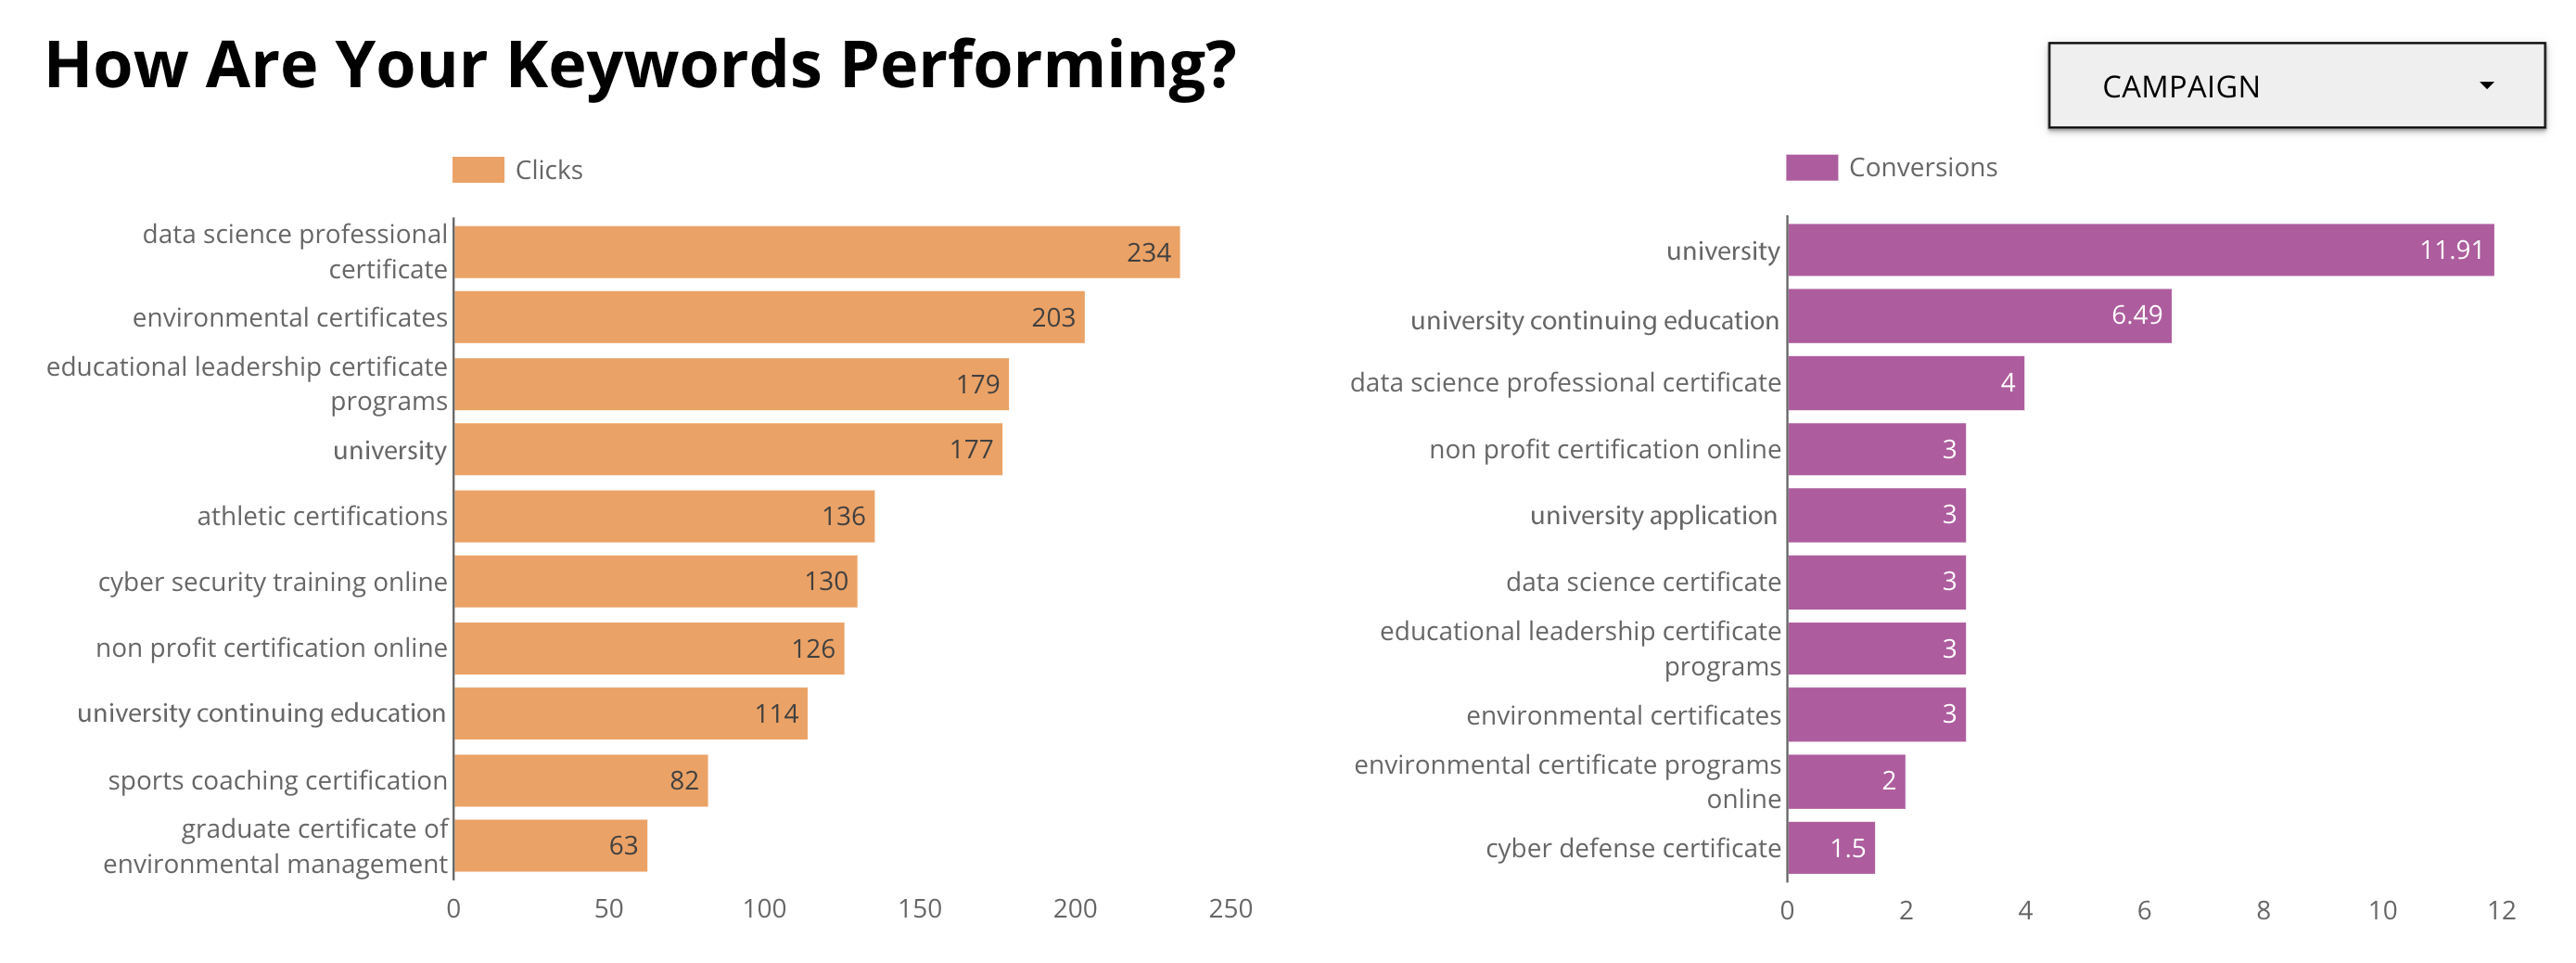
Our KPI dashboard enabled the higher education institution to pinpoint successful areas of their campaign and allocate more resources to them.
Equipped with access to clear data points, our higher education client adjusted their paid and organic search campaigns to include the high-performance keywords driving clicks and conversions.
This attention to detail led to nearly 140,000 impressions in November and December of 2024 alone.
2. Assess lead quality to improve ROI
Not all leads are created equal, and understanding lead quality is essential for maximizing the return on investment (ROI) of your digital advertising campaign.
With an executive KPI dashboard, marketers analyze lead quality in real-time using data visualizations that highlight key insights.
By evaluating key performance indicators like cost per lead (CPL), cost per acquisition (CPA), and cost per inquiry (CPI), you can align your efforts with your strategic goals.
Benefit: Focus on high-quality leads for better ROI
Focusing on high-quality leads ensures your campaigns are both effective and efficient. For instance, tracking engagement indicators such as email open rates, website visits, or time spent on landing pages within an analytical dashboard helps identify leads most likely to convert. Prioritizing these leads allows you to allocate resources more strategically and see a measurable improvement in ROI.
3. Align on KPIs that truly matter
Many marketers struggle with overwhelming amounts of data, making it difficult to focus on what truly drives success. An operational KPI dashboard empowers you to zero in on the relevant data that aligns with your marketing goals.
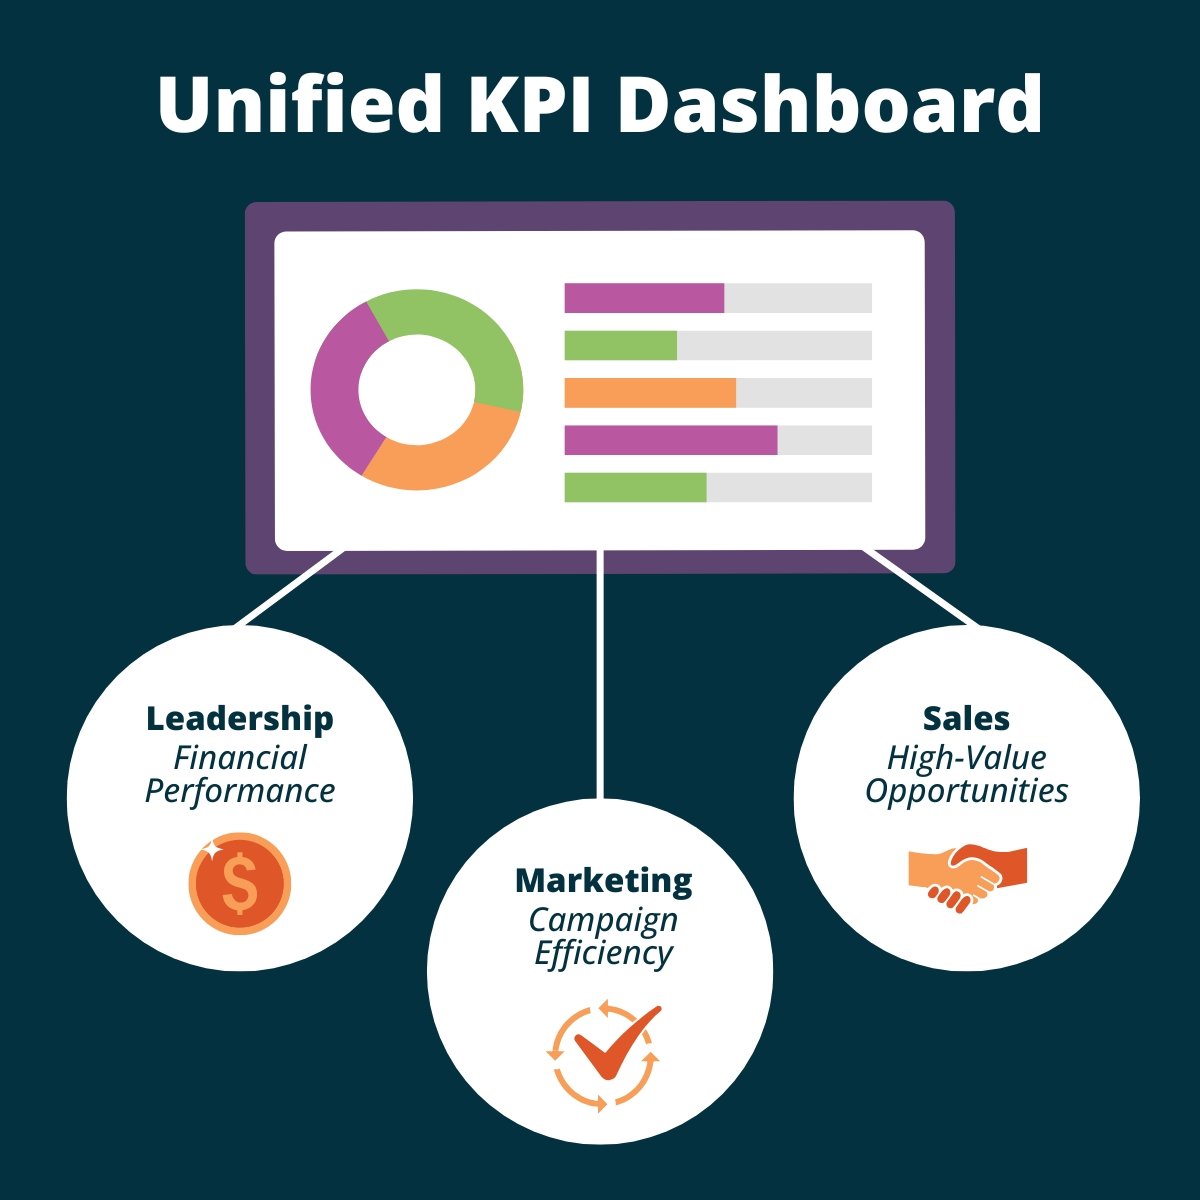
Coordinating key performance indicators across marketing, sales, and leadership teams ensures everyone works toward the same objectives. For example, marketing might track customer acquisition cost (CAC), while the sales team monitors conversion rates. Combining these metrics into a unified KPI report provides a clear picture of performance across departments.
Benefit: Enhanced collaboration and better decisions
When all teams work from the same operational KPI dashboard, it creates alignment that fosters trust and transparency. Leadership can focus on financial performance, sales can prioritize high-value opportunities, and marketing can track campaign efficiency — all while working toward shared strategic goals.
4. Get a clear picture from multiple data sources
Modern marketers rely on an array of tools — Google Analytics, CRMs, social platforms, and more — to collect valuable data. The challenge lies in making sense of these fragmented insights. A marketing KPI dashboard solves this problem by consolidating data from multiple sources into one unified view, creating a reliable single source of truth.
When raw data is combined into a centralized operational dashboard, it transforms into actionable insights. The dashboards’ visual nature gives stakeholders clear insights on how to optimize their campaigns.
By aligning important performance indicators across platforms, business leaders will eliminate silos and ensure all teams are working from the same playbook.
Benefit: Save time and make unified decisions
Consolidating data into a single dashboard saves countless hours of toggling between platforms. It also promotes collaboration by breaking down departmental barriers. With interactive charts and real-time data, decision-makers can easily visualize operational metrics and overall performance.
5. Track critical costs and performance indicators (CPI, ROI, and more)
Budget-conscious decision-making is only possible when you have a clear view of your spending. The right KPI dashboard software makes data analysis straightforward, enabling you to identify where your marketing dollars are used most effectively.
Benefit: Optimize spend and eliminate inefficiencies
Tracking cost-related metrics ensures your campaigns are efficient and impactful. By using your dashboard to analyze data, you will quickly spot underperforming initiatives and reallocate funds to strategies that yield better results.
KPI Dashboard FAQs
How do I create a KPI dashboard?
To create a KPI dashboard, start by identifying the best KPIs for your campaign and marketing goals. Use tools like Google Data Studio, Tableau, or custom software to visualize these metrics. Many of these platforms include template galleries you can tailor to fit your needs and help you get started. You can centralize your insights into a single, cohesive view by integrating data sources such as Google Analytics, CRM tools, and social platforms.
How do you use a KPI dashboard effectively?
To use a KPI dashboard effectively, it’s important to regularly refer to it for actionable insights. This allows you to monitor team progress, track past performance, and adjust strategies as needed.
But without the proper team in place to monitor your dashboard, even this clear, visual aid turns into a sea of confusion.
Hiring an experienced digital marketing agency like Search Influence is like throwing your team a life preserver.
Search Influence ensures you fully leverage your dashboard by using analytics and lead tracking to inform your strategic planning and optimize your efforts. Whether you have questions about results or need to pivot your campaign to new goals, we simplify the process.
What data should be in a KPI dashboard?
A well-designed KPI dashboard should include key indicators tailored to your goals. For marketing, this might involve metrics like cost per impression (CPI), return on investment (ROI), and conversion rates. Sales managers may focus on lead-to-close ratios or revenue growth. The best dashboards also include metrics for monitoring performance, like customer acquisition costs, traffic sources, and campaign engagement, ensuring that all critical data is visible at a glance.
What are the best practices for KPI dashboard design?
- Simplicity: Focus on the most relevant performance metrics to avoid overwhelming users.
- Clarity: Use intuitive charts and visuals to ensure the data displayed is easy to interpret.
- Customization: Tailor your dashboard to align with specific marketing objectives.
- Real-time updates: Ensure data is updated regularly to support data-driven decision-making.
- Accessibility: Design for all stakeholders, so everyone benefits from the insights.
What are the three essential elements of a KPI dashboard?
- Data consolidation: Integrate information from multiple sources to create a unified view.
- Real-time tracking: Include up-to-date metrics to ensure accurate performance monitoring and informed decisions.
- Actionable insights: Focus on metrics that drive strategic planning and empower your team to make data-driven decisions.
Turn Data Into Decisions With Help From Search Influence
KPI dashboards are indispensable for marketers and business leaders aiming to stay ahead in 2025. They help you visualize your funnel, assess lead quality, align team goals, consolidate multiple data sources, and track critical costs.
Search Influence has the expertise to create and analyze custom dashboards that align with your marketing objectives. We help you focus on the metrics that matter, enabling you to optimize your strategies and achieve better results.
Take the guesswork out of your data.
Contact Search Influence to see how we will help you harness the power of KPI dashboards and elevate your business with our digital marketing services.


